Education & Resources Top 10 Lists for Seafood Consumption
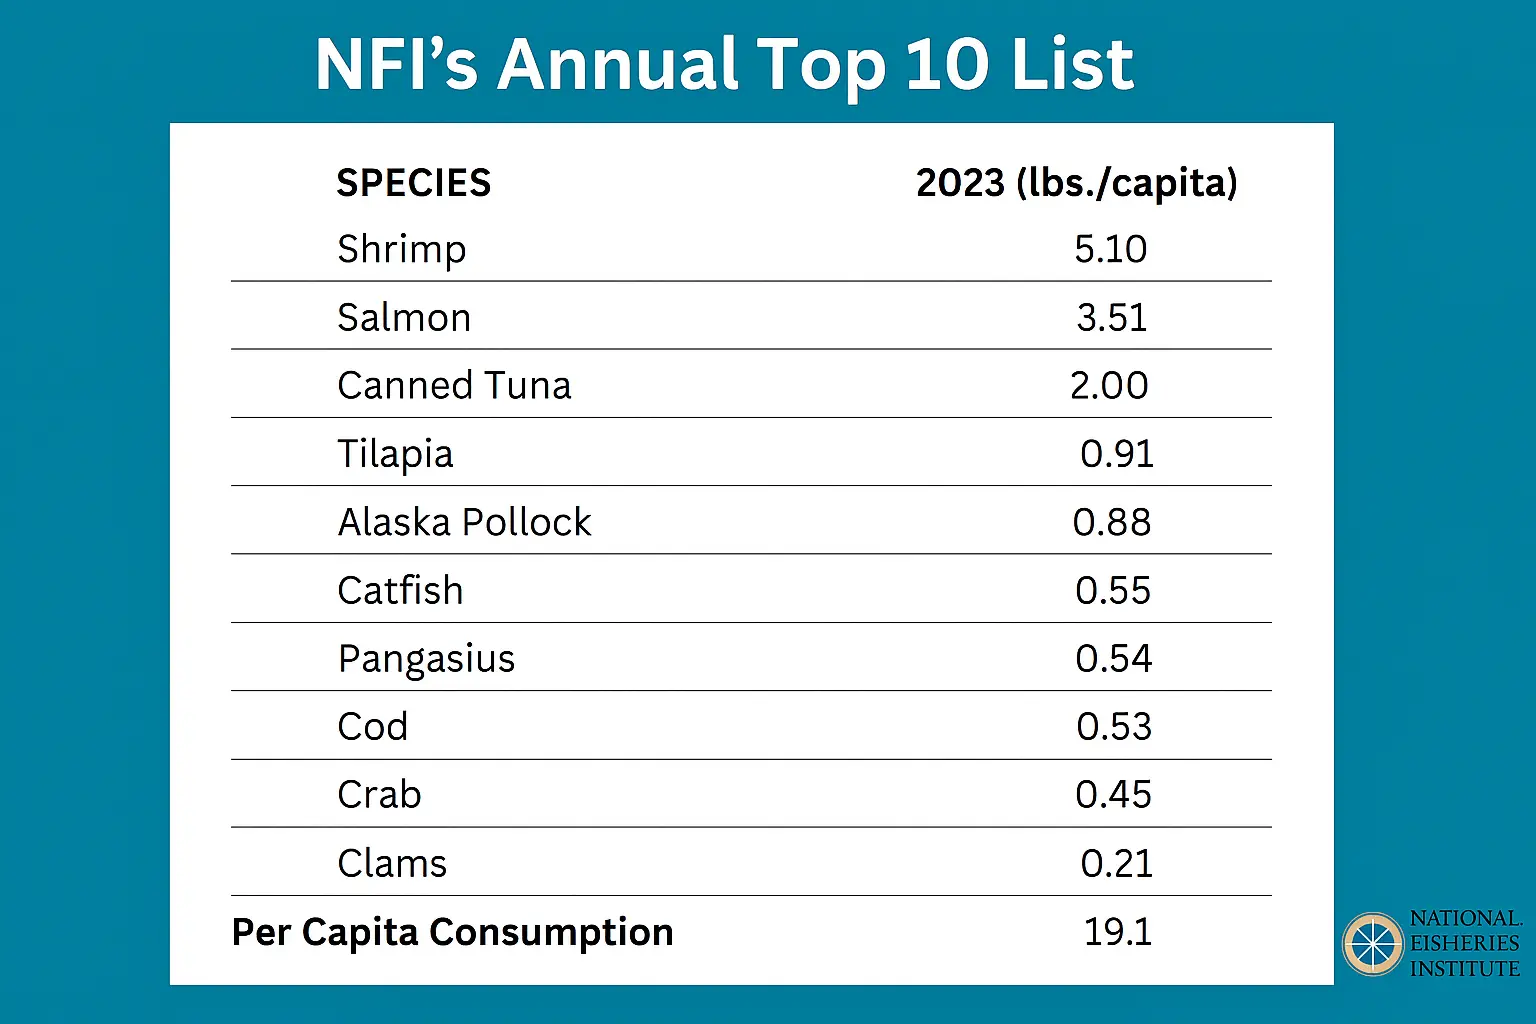
Ranking data comes from NOAA’s annual Fisheries of the United States Report.
The latest numbers show an uptick in comsuption of Salmon and Alaska Pollock.
2023 Per Capita Consumption: 19.1 • 2023 Total Top 10: 14.69 • All other species consumption: 4.41 • Top 10 as % of Total Consumption: 77%
Top 10 List Reveals Continued DiversificationMarch 11, 2026 – Reston, Virginia – In 2023, Americans ate 19.1 pounds of seafood per capita, with…
November 11, 2024 - Reston, VA – In 2022, Americans consumed 19.7 pounds of seafood per capita, down 0.8…
Fresh & Frozen Helped Grow Seafood ConsumptionWASHINGTON, D.C. — June 7, 2023 — In 2021, Americans consumed a record 20.5 pounds…
2020 consumption illustrates contraction at foodservice but growth for some species May 16, 2022 – Washington, DC – In 2020, Americans…
Americans ate slightly more seafood in 2018 than in 2017
Diversification outside the Top Ten Might Be the Real Story
List Features Favorites, Illustrates Important Nutritional TrendNovember 2, 2017 – Washington, DC – In 2016 Americans ate 14.9 pounds…
Americans eating more seafood for 3rd Straight year
Health conscious consumers help edge seafood higher
Slight increase in consumption seen as public health opportunity
Familiarity and Stability seen in Annual Rankings
10 Most Popular Make up More than 90% of the Fish Eaten
Tilapia and Pangasius continue their rise
Despite dip in per capita consumption favorites remain entrenched
Seafood Consumption Dips Slightly but Shrimp and Tuna Still Favorites
Despite Slight Decline in Seafood Consumption List Remains Steady